The Texas A&M Energy Price Index is a novel predictive framework that estimates the price of energy across the U.S. and models scenarios that can lead to an optimized and efficient energy transition.
The Texas A&M Energy Institute has developed a novel optimization and machine learning-based framework that introduces a benchmark of the average price of energy in the United States as well as a comprehensive, reliable, and easily interpretable instrument for policymakers to determine the quantitative effects of various energy related policies.
Similar to the S&P 500 index for the stock market, the Texas A&M Energy Price Index (EPIC) estimates the average price of energy across the entire energy landscape in the United States. EPIC collectively captures the two key attributes of energy – the supply & demand mechanisms along with the prices of the energy feedstocks and products of the entire energy landscape – and reveals crucial information about the impact of major global events, new monetary and fiscal policies and consumer trend changes on the energy markets.
A Predictive Tool: the Energy Price Index (EPIC)
Despite using the latest data from a variety of sources such as the U.S. Energy Information Administration, the U.S. Department of Energy, the U.S. Department of Labor, as well as Refinitiv and Bloomberg, there is a lag of several months on the real data of energy demands and prices. EPIC’s novel predictive capabilities allow the accurate forecasting of the necessary data up to the present day.
Energy Price Sub-Indices
Apart from a holistic price of energy, the high level of the framework’s granularity enables the calculation of the average price of energy for the end-use sectors of the economy through the introduction of four energy price sub-indices – Residential EPIC (REPIC), Commercial EPIC (CEPIC), Industrial EPIC (INEPIC), and Transportation EPIC (TEPIC).
Quantitative Analysis Towards the Energy Transition
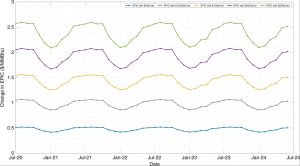
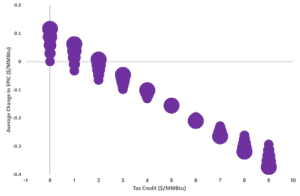
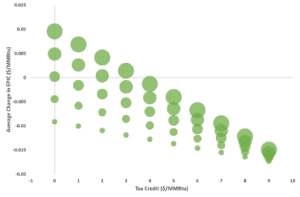
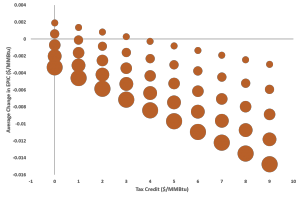
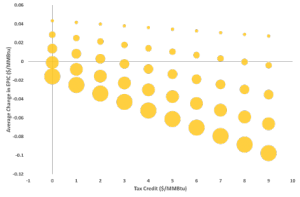
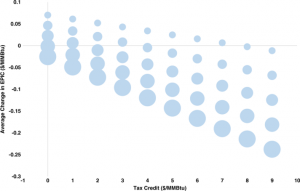
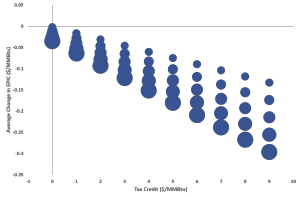
EPIC’s predictive ability and unique structure can be utilized for the quantitative design, assessment, and optimization of energy-related policies. In a recent publication in Nature Communications, two such policy case studies are demonstrated – one analyzing the effects of renewable energy production targets and subsidies on energy consumers and another one investigating the effects of a crude oil tax on the price of energy along with the revenue generated. The scenarios are conducted parametrically for a wide range of values, and the effects are investigated retrospectively and prospectively.
Renewable Energy Target Weights and Tax Credits
Bubble Size Represents Target Weights
Visit the Texas A&M Energy Price Index (EPIC) website at https://parametric.tamu.edu/EPIC/.


